


![Stephen King Reads an Excerpt from New Novel ‘Never Flinch’ [Video]](https://bloody-disgusting.com/wp-content/uploads/2025/04/stephenking-reading.jpg)
![How George A. Romero’s ‘The Amusement Park’ Went from Lost Media to a Graphic Novel [Interview]](https://i0.wp.com/bloody-disgusting.com/wp-content/uploads/2021/02/Cross.jpg?fit=1200%2C904&ssl=1)


![Earn 5,000 Bonus Points for Paying Bills with Hyatt Card [Targeted]](https://boardingarea.com/wp-content/uploads/2025/04/f8cad0855e8ffab71e3c8ad284d8004b.jpg?#)


![Hotel Beds Outperform Your Master Bedroom for Better Sex—Here’s Why [Roundup]](https://viewfromthewing.com/wp-content/uploads/2025/04/burj-al-arab-bed.jpg?#)


.jpg?width=1920&height=1920&fit=bounds&quality=70&format=jpg&auto=webp#)


![[Podcast] Unlocking Innovation: How Play & Creativity Drive Success with Melissa Dinwiddie](https://justcreative.com/wp-content/uploads/2025/04/melissa-dinwiddie-youtube.png)


“Product Kondo”: A Guide To Evaluating Your Organizational Product Portfolio
It starts with good intentions — a quick fix here, a shiny feature there — and suddenly, your product portfolio’s bursting at the seams. In this guide, Talke Hoppmann-Walton walks you through a “Product Kondo” exercise to declutter, realign, and spark some serious product joy for both your business and your customers.

When building digital products, thinking in terms of single features and urgent client needs can lead to a large portfolio of products with high maintenance costs. At first, this approach makes sense, as you’re offering new value to customers and keeping important clients happy. But, over time, you often end up with a collection of highly bespoke solutions that ignore two key principles:
- Your product portfolio should cater to your core customer segments and meet their needs.
- Your product portfolio should balance the short-term benefits of bespoke solutions against long-term maintenance costs while aligning with your business strategy.
So the reality often looks like this: large legacy product portfolios have grown over time, and the effort required to clean up is hard to prioritize against other seemingly more pressing topics.
This article highlights the benefits of going through a clean-up exercise and explains how to conduct a “Product Kondo” exercise on your product portfolio. Like Marie Kondo, the Japanese master of cleaning up closets and houses to keep what brings you joy, discard what you no longer need, and organize what you keep into a workable order, this exercise seeks to identify the most valuable items for both your business and your customers. This article discusses the issues with large legacy portfolios and explains how to simplify and organize them into customer-centric portfolios, with stakeholder buy-in throughout the process. Overflowing Product Cupboards
There are many reasons why an organization might end up with a large legacy product portfolio, which, similar to the cupboards organized by Marie Kondo, is in dire need of a good clean-up. Whether your portfolio is overgrown from crafting bespoke solutions for important enterprise clients (a common B2B scenario), from testing new features with a B2C customer segment, or various other possible reasons, incentive structures chiefly among them — overgrown portfolios are very common. And the problem is they need to not just be developed in the first place, they need to be maintained, and that gets ever more costly and complex over time.
While this might be oversimplified, the general logic holds true: the more bespoke your product portfolio, the harder it is to keep clean and tidy. Or as Marie Kondo would say, “In a messy cupboard, it’s impossible to find the pieces that truly bring you joy.” In this context, joy translates into:
- Value for the customer,
- Revenue for the business.
If you want to work out how to find that joy in your product portfolio again, this article outlines the practical steps taken for such a “Product Kondo” exercise in a global not-for-profit organization with a large legacy portfolio, including the moment when theory met reality, and the learnings from this effort.
We conducted this clean-up in a globally distributed organization undergoing a wider transformation. For more than 20 years, the organization had been gathering and distributing data in various formats: from raw to modelled data, scores, and advanced data products. However, it had not been focused on customer centricity nor regarded products as strategic differentiators. This meant that key indicators of success for product organizations had never been tracked. So the challenge was to map out and simplify the portfolio with very few indicators available to track product performance (e.g., user analytics data).
So, how do you start understanding where the value lies in your portfolio and what factors are driving this portfolio clean-up in the first place?
As part of the wider organizational transformation, one consideration was to simplify the product portfolio in order to reduce maintenance costs and the technical effort required for a planned migration to a new platform. Another important concern was to align future development with the newly developed business strategy. Therefore, reducing costs and planning for the future were the key drivers. The “Product Kondo” Portfolio Clean-up
So if you find yourself in a similar situation, where you have a complex legacy portfolio, and where across many years features have been added, but hardly anything has ever been sunset, a “Product Kondo” clean-up, i.e., a cleaning out of your product cupboards, might be what’s needed.
To do that, it’s useful to go in with two ideas:
- Transparency about the need to simplify;
- Transparency about how decisions will be made, so teams are on board and able to contribute.
Getting buy-in and building a narrative everyone understands and sees as relevant is crucial when trying to clean up — especially in large companies, where you’ll always find someone who thinks “we need everything,” and the relative importance of different customer segments is unclear, with no accurate portfolio overview in place.
If you’re unclear about the state of your current portfolio, how do you know where to focus next strategically?
Not knowing where the highest value lies in your portfolio and how it all maps out as a whole has another implication: If you don’t know your current status quo, it’s hard to plan ahead and it’s equally hard to get out of the delivery mode many product organizations find themselves in, where you simply build what gets requested, but can’t act as a driver of future growth.
To organize a portfolio in order to define how to handle it going forward, while not having much information to base decisions on, the high-level approach was this:
- Define the FOR WHOM (By building a user segmentation matrix).
- Establish the STATUS QUO (By auditing previous attempts to map the portfolio).
- Agree the HOW (By defining evaluation criteria & prioritisation).
- Ensuring BUY-IN (through deep dives with key stakeholders and experts).
Note: Every company is different, especially regarding the information that’s available. So this is not an attempt at building the next framework or providing a one-size-fits-all approach to portfolio organization. Instead, it is a proposed solution for how to approach mapping out your current portfolio to start from a cleaner slate, with your customer segments in mind. These four areas of work should be considered as necessary when attempting a “product kondo” exercise in your own organization.
1. For Whom? Building A User Segmentation Matrix
First things first, if you’re not clear about your primary and secondary customer segments, then this is where to start. If you want teams to be able to focus, it’s crucial to define priorities. Identifying key external user groups/segments, understanding their differences, and assessing their importance to the organization’s overall business success is a great start. Building a user segmentation matrix is a great foundation for prioritizing efforts and aligning services/products around user needs.
Apart from establishing the key jobs-to-be-done, goals, and pain points for each customer segment, it fosters transparency around the following factors:
- Thinking from a customer perspective.
- Considering measurable data like user numbers, size of accounts, and revenue.
- The fact that some user groups are more valuable to an organization than others, hence should be ranked higher in a prioritization effort.
How to define user segments, with different levels of relevance to the organization and its future strategy, is described in more detail here. It was the initial mental model shared across teams prior to starting this portfolio simplification effort.
Next up: Understanding the current status quo and building a “source of truth” of everything considered under the remit of the product organization. Because you need a clear reference point to get started.
2. Status Quo: Auditing And Defining What To Measure
To determine the best approach and size the task ahead, understanding what had been done before was crucial, so as not to reinvent the wheel. It was clear that the organization had a sprawling product catalogue that contained a varied mix of different items, lacking clear definitions and categorization.
The initial audit was about updating the product catalog that had been assembled three years earlier and adding information that would be relevant for assessing relative value. As revenue, user numbers, or development effort had never been tracked, this is where we gathered additional insights on each item from the product owners (POs) responsible.
The assessment criteria were partly taken from the previous effort (criteria 1-9), and further criteria were added to obtain a more holistic picture (criteria 10-15). See the table below.

3. How? Doing The Audit
In order to be transparent about decision-making, it was important to agree on the evaluation criteria and scoring with key stakeholders upfront and ensure every contributor understood that a lack of data would lead to low scores. To that end, we asked all 36 product owners (POs) to submit data for each product under their remit. As the organization had not previously tracked this information, the initial responses were often quite vague, and many cells were left blank.
To increase data quality and make data-based decisions, 1:1 interviews with POs allowed us to answer questions and build out “best guess” assumptions together in cases of missing data.
Note: While not technically perfect, we decided that moving forward with assumptions grounded in subject matter expertise, rather than completely missing data, would be preferable.
Lastly, some inputs like “automation potential” were hard to assess for less technical POs. Our approach here followed the product mindset that while it is important to make data-informed decisions, “done is better than perfect.” So once we had enough confidence in the picture that emerged, we proceeded with scoring in the interest of time.
As a side note regarding data quality: 1. Manually cleaning inputs throughout (e.g., removing duplicates) and 2. following up until clear inputs were provided, helped increase input quality. In addition, predefined ranges led to higher data quality than inputs requiring hard-to-quantify data, like, e.g., expected impact.
3.1. Scoring
Defining the scoring methodology upfront and getting stakeholders to align on the relevance of different criteria transparently was crucial for this work. Particularly keeping in mind that simplifying (in other words, reducing) the portfolio has an immediate impact on various teams, communicating openly about what is being done, how, and why is important, so everyone understands the longer-term goal: to reduce cost, maintenance, and prepare for future growth.
The image below illustrates the three stages that led to the prioritized list and score for each item.

The outcome of this stage now ranked the business and user value for each data product, and the initial expectation was that this was the end of the portfolio cleanup. A list of all items ranked by their value to the business, so that, e.g., the bottom half could be cut and the rest migrated to the new technical platform in order of priority.
At least that was the theory, and this is where it met reality.
Dealing With Change Reality
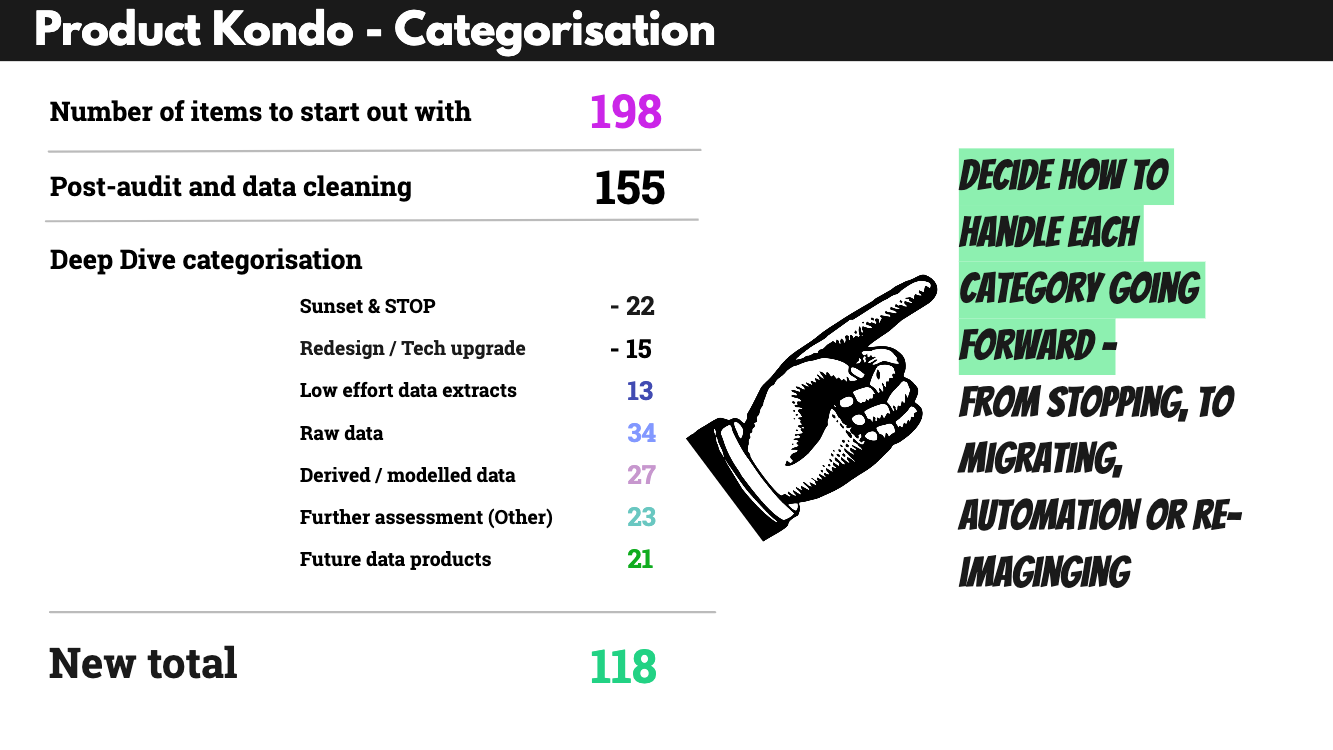
Once the weighted list was ready and the whole portfolio was ranked, it became clear that what was considered the “Product portfolio” in fact consisted of 12 different types of items, and roughly 70% of them could not be considered actual products.
While inside the organization, everything was called a PRODUCT, it became clear that the types of items referred to as “products” were in fact a mixed bag of trackers, tables, graphs, extracts, data sets, dashboards, reports, tools, scoring, and so on. And many low-ranking internal-facing tools enabled highly relevant customer-facing products.
The list was essentially comparing “apples to oranges,” and that meant that simply cutting the bottom half of lower-scoring items would lead to the whole “house of cards” tumbling down, especially as a lot of items had dependencies on each other.
What To Do?
First and foremost, we worked with leadership to explain the issue of missing categorization in the portfolio and the risks that cutting the lower-scoring half of the list would entail, especially due to the time pressures of the wider ongoing transformation effort.
Next, we proposed to work with key product owners and leaders to help categorize the portfolio correctly, in order to determine how best to handle each item going forward.
We used the following five buckets to enable sorting, with the intention of keeping the “other” category as small as possible.

Aside from simplifying the terminology used, this categorization meant that each category could be handled differently in terms of future work.
For example, all raw data items would be automated, while the process around “low effort” data items didn’t have to be changed going forward, once it was clear how low the manual effort actually was. Notably, the categorization included a “Sunset/Stop” category to allow stakeholders to already move items there during the deep dives of their own volition, rather than through top-down decision making.
4. Getting Buy-in: Building Product Trees
To get buy-in and allow for active contributions from subject matter experts, we planned workshops per customer segment (as defined by the user segmentation matrix — the initial starting point). Aside from organizing the portfolio items, these workshops allowed key people to be actively involved and thereby act as advocates for the future success of this work.
Using Miro boards to share all audit findings, goals, and the purpose of the clean-up, we conducted seven workshops overall. With 4–6 participants, we spent 3 hours categorizing all items per customer segment. In order to avoid groupthink, all participants were asked to cluster their part of the portfolio as part of the preparation.
The “product tree” concept, developed as an innovation game called “prune the product tree” by Luke Hohmann to organize features around customer needs, helped create a shared mental model among participants. In contrast to Hohmann, we applied the product tree concept here to organize the current portfolio logically and actively reduce it, rather than imagine new products.
In this context, the roots of the tree signified raw data, the tree trunk equated to modeled or derived data, with the crown of the tree signifying data products, and the outer branches were left for “other” items — to capture what could not be easily grouped but had to be included.

Grouping items in this way served a second purpose: to guide how to handle them in the future transformation effort. The plan was to automate raw data first, based on priority. While modeled or derived data would have to be checked for complexity to determine future handling. The actual data products identified would be crucial for the company’s future strategy and were to be reimagined with a product mindset going forward.
The tree metaphor worked well here, despite being used in a different way from its original context, as it provided a mental model for categorization. By clustering items, it was possible to better determine their value for each customer segment in the portfolio. According to the feedback gathered after each workshop, the joint mapping and visualization helped teams trust the process and feel actively involved. Findings
Analyzing the findings from the workshops revealed the complexity of this effort, with many different factors playing into the prioritization. To visualize this complexity, we used the following approach:
- Mapping out the product tree by swimlanes (as introduced in the workshops).
- Layering in usage across multiple segments (through color-coding).
- Adding the level of dependencies (through the type of frame around each item).
- Then, add the quantitative assessment and ranking through numbering and color-coding.
For each workshop, we cleaned up the boards, making sure to include crucial comments, especially those about future treatment, such as when a legal obligation to deliver would end.

Using swimlanes helped participants organize data items, while the tree metaphor clarified the interconnectedness and dependencies between items. Especially in the context of data products, this makes a lot of sense, e.g., with raw data being at the root of all other possible versions of “products” derived from them, whether these might be scores, modelled data, automated reports, or more advanced products.
Doing this Product Kondo exercise also helped the teams and all stakeholders gain a shared understanding of how the portfolio was structured for each customer segment. The visualization in swimlanes and with colour-coding and various different frames provided a way to illustrate the complex reality that the initial ranked list format wasn’t able to clarify.
Only once this portfolio mapping was in place, and once quantitative as well as qualitative insights were combined, was it possible to make good decisions about how to handle each item going forward.
For example, all items in the “raw data” category would be automated as part of the wider transformation effort, while all items in the “sunset” category would definitely not be considered for migrating over to the new tech platform. Moreover, the items grouped under “low effort” would continue to be handled manually, while all items grouped under “derived & modelled” would have to be assessed further by a team of tech leads to determine whether or not they might be automated in the future. The items most relevant for the future business strategy of this organization were those grouped under “data products”, i.e., those products that would have to be re-imagined with clear customer needs in mind, based on the user segmentation matrix. Learnings
In total, we achieved a portfolio reduction of 67.8% from 198 items initially to 118 post clean-up. However, what matters here is not simply the reduction but the categorization, i.e., separating and organizing the portfolio into different swimlanes and introducing the product tree metaphor. The product tree visualisation helped all stakeholders understand the interconnectedness of the portfolio, where the roots signify the core product and the branches different, more advanced products or features built on top of that core.
Similarly, the categorization into swimlanes helped to organize and cluster similar items, getting away from comparing apples and oranges in the initial big portfolio audit table. It illustrated very clearly that not all items are alike and can’t be judged and rated in the same way.
It is worth mentioning that there is no one best way to label your swimlanes, but a good starting point is to think of naming different clusters, e.g., from basic to most complex, and to always include a “sunset/stop” cluster and potentially one that covers “redesign/tech upgrade” items. Having these two buckets allows contributors to actively shape the decision-making around the quick-win items, usually the most obviously outdated or clunky parts of the portfolio.
Whether or not you categorize your products in order to determine how to handle them in an organizational transformation, e.g., to assess automation potential, will largely depend on why and when you’re cleaning up your product portfolio. Even outside of a transformation effort, clustering your portfolio into different categories, understanding interconnectedness, and whether or not each customer segment has a well-rounded product tree, with solid roots and future-looking branches, is a useful exercise in sense-making and keeping your organization lean.
Shared Terminology Matters
In all this, our biggest learning was that
Terminology matters because simply referring to things as “products” doesn’t make them so. Comparing like for like is a key factor when assessing a product portfolio.
Correct categorization was the biggest challenge that had to be dealt with first, to enable the organization to iterate and focus on where to play and re-imagine products to match the future business strategy.
When Theory Meets Reality
This portfolio clean-up had to pivot and expand to include a mapping exercise because we hadn’t factored in the unclear terminology used across the organization, and that, instead of simply gathering and ranking, the biggest task was to correctly categorize and structure. And this is likely to be different from organization to organization. So I would always recommend checking which categories of items you’re comparing in your portfolio. If you’re not entirely sure, you should always include a clustering or mapping exercise right from the start. Product Kondo: The Groundwork For Transformation
If you’re struggling with a large legacy portfolio and no longer confident that everything in it serves a purpose and brings joy to users and the business, it’s time to clean up.
It’s often necessary and needed to focus on the next shiny thing, but if you don’t balance that with cleaning up your existing portfolio, your organization will eventually become slow. Overgrown product portfolios can’t be sustained forever.
Particularly in organizations bound by various contractual obligations, this is the groundwork that enables product teams to iterate.
Moreover, doing this clean-up and clearing out effort across teams is a highly transparent way to include teams in change. And it is a useful way for getting teams to contribute and actively shape a transformation effort. Business decisions have to be taken, but taking them with transparency and in an evidence-guided way ensures that you are bringing people along.

Last but not least — if you don’t have the capacity to do the full portfolio clean-up (which took us about 4 months, with a core team of roughly 4 people) — start smaller. And start with including these considerations in your day-to-day, for example, by always checking if products or features should be stopped or sunset every time you’re launching new products. Or start by mapping out the different categories of items in your portfolio — with swimlanes and the product tree metaphor in mind. What is core, and what is the future state of play?
Upside: Once you’ve got that big picture overview and worked out what to sunset or where to slim down, you have more capacity to focus on current and future priorities strategically.
Reality check: Of course, the work doesn’t stop there. The next step is to align it all back to your user segments and check how your portfolio serves each of these, particularly the primary segments.
Further Reading
- “Product-Led Growth: The Ultimate Guide for Software Companies,” Userpilot
- “Evidence-Guided: Creating High-Impact Products in the Face of Uncertainty,” Itamar Gilad
- “Innovation Games: Exploring Luke Hohmann’s Game-Changing Approach,” Matt Hicks
- “Building A User Segmentation Matrix To Foster Cross-Org Alignment,” Talke Hoppmann-Walton
- “What Is A Product Portfolio Roadmap?,” Kareem Mayan


